Northern Virginia market intelligence
Northern Virginia Real Estate Market Update
The latest full market report appears first. Previous monthly updates remain available in the five-year archive below.
Northern Virginia held its value while sales volume softened
Across the six markets in this report, 2,890 homes closed in July—1.8% fewer than the 2,944 sales recorded a year earlier. The median sale price rose 1.4% to $700,000, while the typical home sold in 10 days and at 100.0% of its final list price.
Four numbers that frame the month
The headline is not simply “prices are up” or “sales are down.” It is a market of speed, price sensitivity and sharply different entry points.Property type changes the conversation
Detached homes carried the highest median, but townhouses were the fastest-moving segment. Condos offered the lowest regional median and the most time to evaluate, with a median 18 days on market.| Property type | Closed sales | Median price | Median DOM | Sale/list |
|---|---|---|---|---|
| Single-family | 1,494 | $900,000 | 9 days | 100.3% |
| Townhouse | 757 | $640,000 | 8 days | 100.4% |
| Condo | 633 | $425,000 | 18 days | 99.1% |
Concessions appeared in 42.5% of all July transactions: 38.2% of single-family sales, 46.1% of townhouse sales and 48.5% of condo sales. A concession may include seller-paid closing costs or other negotiated credits.
Fairfax County real estate market
Fairfax remains the region’s largest transaction engine. July buyers closed 1,170 homes at a $754,000 median, with the typical sale taking nine days and landing just above asking.
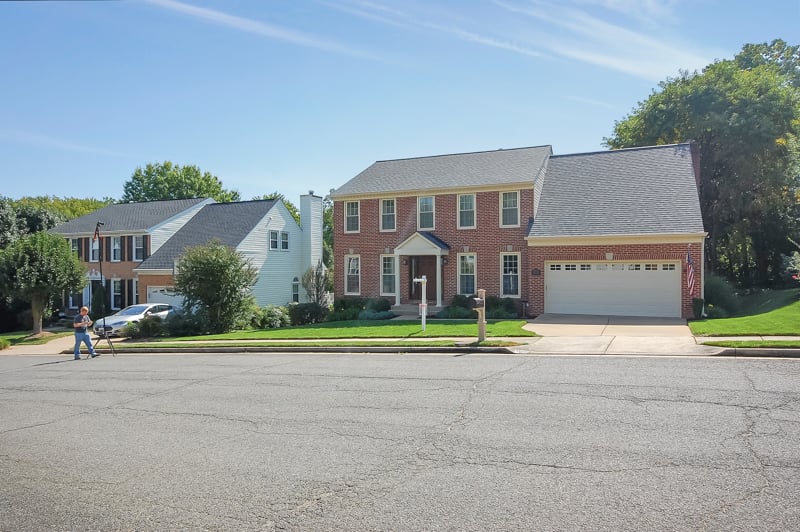
From McLean and Reston to Springfield and Centreville, Fairfax County contains several distinct price bands. The countywide median is useful context, but a condo near Metro and a detached home in the western part of the county do not compete in the same market.
What changed: the July median sale price was -2.2% from July 2025, while closed sales were -2.4%. Detached homes posted a $990,000 median, compared with $650,000 for townhouses and $396,500 for condos. The typical condo took longer to sell than a townhouse, a reminder that property type can matter as much as the county name.
The three busiest ZIP codes
These ZIP codes recorded the most closed sales in July. Volume is a useful starting point, but the price and days-on-market columns show why buyers and sellers should compare the neighborhood and property type—not just the county average.22030
$754,500 Median sale price20120
$650,000 Median sale price22003
$785,000 Median sale priceHow the property types compare
| Property type | Closed sales | Median price | Median DOM | Sale/list |
|---|---|---|---|---|
| Single-family | 614 | $990,000 | 7.5 days | 100.4% |
| Townhouse | 300 | $650,000 | 7 days | 100.4% |
| Condo | 254 | $396,500 | 19 days | 98.9% |
Loudoun County real estate market
Loudoun’s July market paired an $814,000 median price with 515 closed sales. The county’s strongest ZIPs show how new-construction corridors and established communities can produce very different price points inside the same county.

Loudoun combines established eastern neighborhoods, newer communities around Ashburn and Brambleton, and a more rural western market. That mix produces a wide spread between condo, townhouse and detached-home prices.
What changed: the July median sale price was +8.0% from July 2025, while closed sales were -3.9%. Detached homes posted a $1,060,000 median, compared with $712,500 for townhouses and $504,000 for condos. The typical condo took longer to sell than a townhouse, a reminder that property type can matter as much as the county name.
The three busiest ZIP codes
These ZIP codes recorded the most closed sales in July. Volume is a useful starting point, but the price and days-on-market columns show why buyers and sellers should compare the neighborhood and property type—not just the county average.20148
$860,000 Median sale price20176
$840,000 Median sale price20147
$688,500 Median sale priceHow the property types compare
| Property type | Closed sales | Median price | Median DOM | Sale/list |
|---|---|---|---|---|
| Single-family | 269 | $1,060,000 | 9 days | 100.4% |
| Townhouse | 168 | $712,500 | 9 days | 99.8% |
| Condo | 78 | $504,000 | 21.5 days | 99.0% |
Prince William County real estate market
Prince William offered the largest closed-sale volume after Fairfax while maintaining a $589,450 median price. Well-priced homes still moved quickly, but the property-type breakdown shows meaningful differences in both price and negotiating leverage.
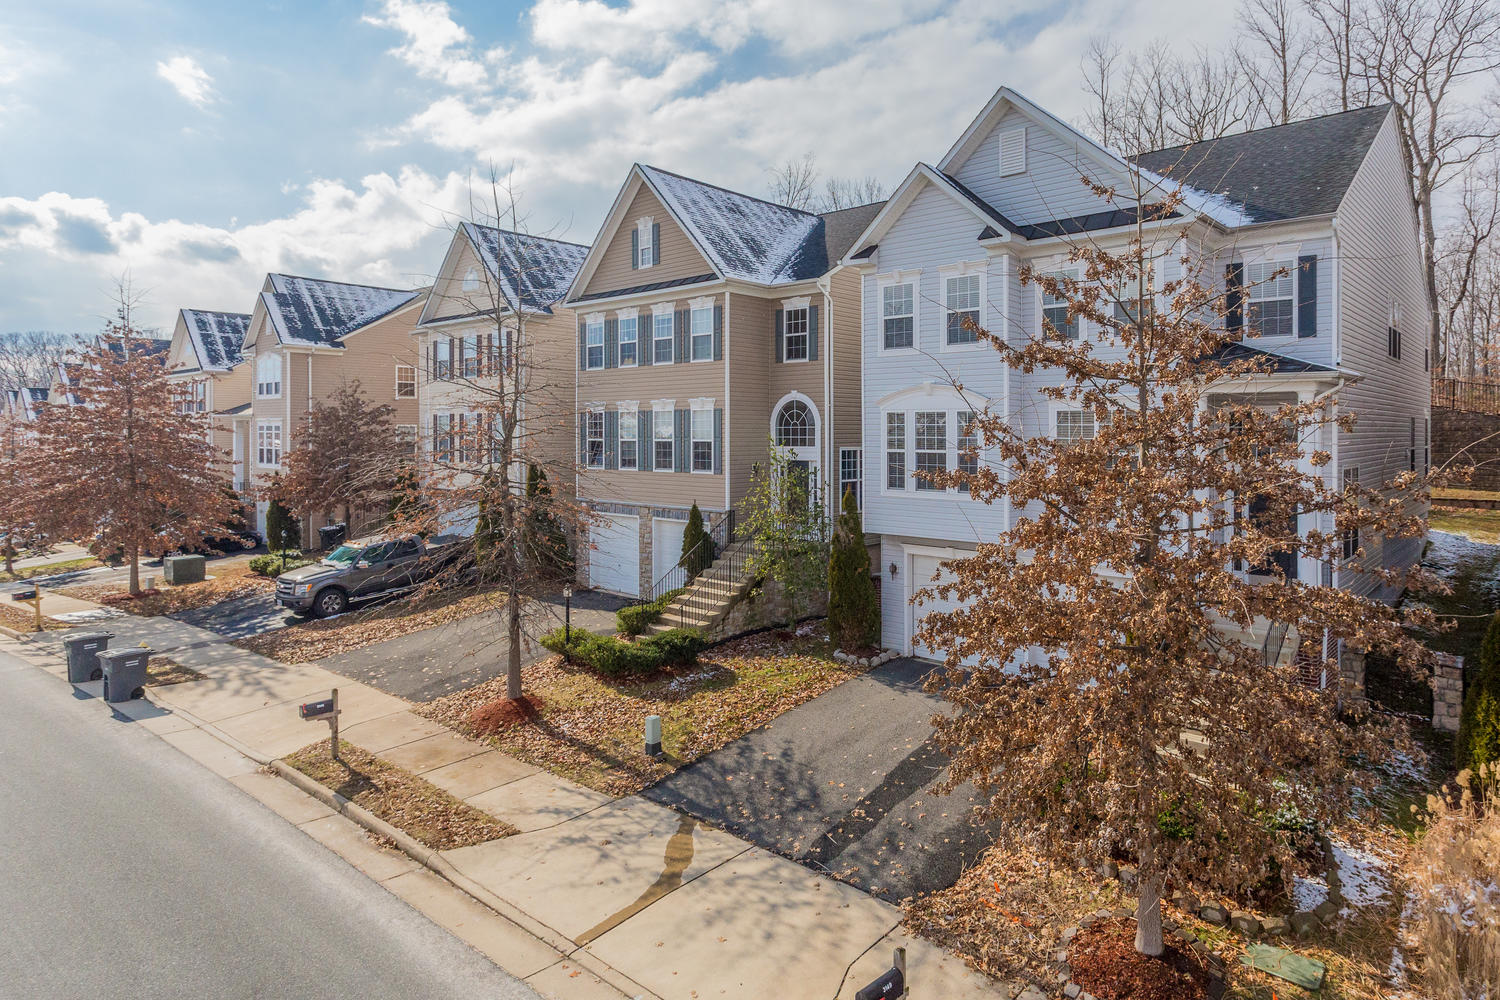
Prince William stretches from the I-95 corridor around Woodbridge to Manassas, Gainesville and Haymarket. Buyers should compare submarkets carefully because commute patterns, housing age and property type shift quickly across the county.
What changed: the July median sale price was +2.9% from July 2025, while closed sales were -0.2%. Detached homes posted a $712,000 median, compared with $515,000 for townhouses and $422,000 for condos. The typical condo took longer to sell than a townhouse, a reminder that property type can matter as much as the county name.
The three busiest ZIP codes
These ZIP codes recorded the most closed sales in July. Volume is a useful starting point, but the price and days-on-market columns show why buyers and sellers should compare the neighborhood and property type—not just the county average.22193
$547,450 Median sale price22192
$520,000 Median sale price20110
$533,804 Median sale priceHow the property types compare
| Property type | Closed sales | Median price | Median DOM | Sale/list |
|---|---|---|---|---|
| Single-family | 287 | $712,000 | 9 days | 100.2% |
| Townhouse | 189 | $515,000 | 9 days | 100.9% |
| Condo | 86 | $422,000 | 19.5 days | 99.3% |
Arlington County real estate market
Arlington closed 229 sales at an $823,000 median. Its countywide result hides a dramatic housing mix: entry-level condos, scarce townhouses, and detached homes whose median exceeded $1.3 million.

Arlington is a compact, transit-oriented market where condos account for a large share of sales, while detached homes command a much higher price tier. Countywide figures therefore change with the mix of homes that close in a given month.
What changed: the July median sale price was +13.1% from July 2025, while closed sales were -5.4%. Detached homes posted a $1,377,500 median, compared with $1,040,000 for townhouses and $473,450 for condos. The typical condo took longer to sell than a townhouse, a reminder that property type can matter as much as the county name.
The three busiest ZIP codes
These ZIP codes recorded the most closed sales in July. Volume is a useful starting point, but the price and days-on-market columns show why buyers and sellers should compare the neighborhood and property type—not just the county average.22201
$791,500 Median sale price22207
$1,700,000 Median sale price22204
$700,000 Median sale priceHow the property types compare
| Property type | Closed sales | Median price | Median DOM | Sale/list |
|---|---|---|---|---|
| Condo | 110 | $473,450 | 13.5 days | 99.1% |
| Single-family | 98 | $1,377,500 | 8 days | 100.1% |
| Townhouse | 21 | $1,040,000 | 5 days | 101.4% |
City of Alexandria real estate market
Alexandria’s 192 July closings produced a $736,500 median price. Attached housing dominates the city’s volume, while townhouse and detached-home medians reflect a much higher price tier.
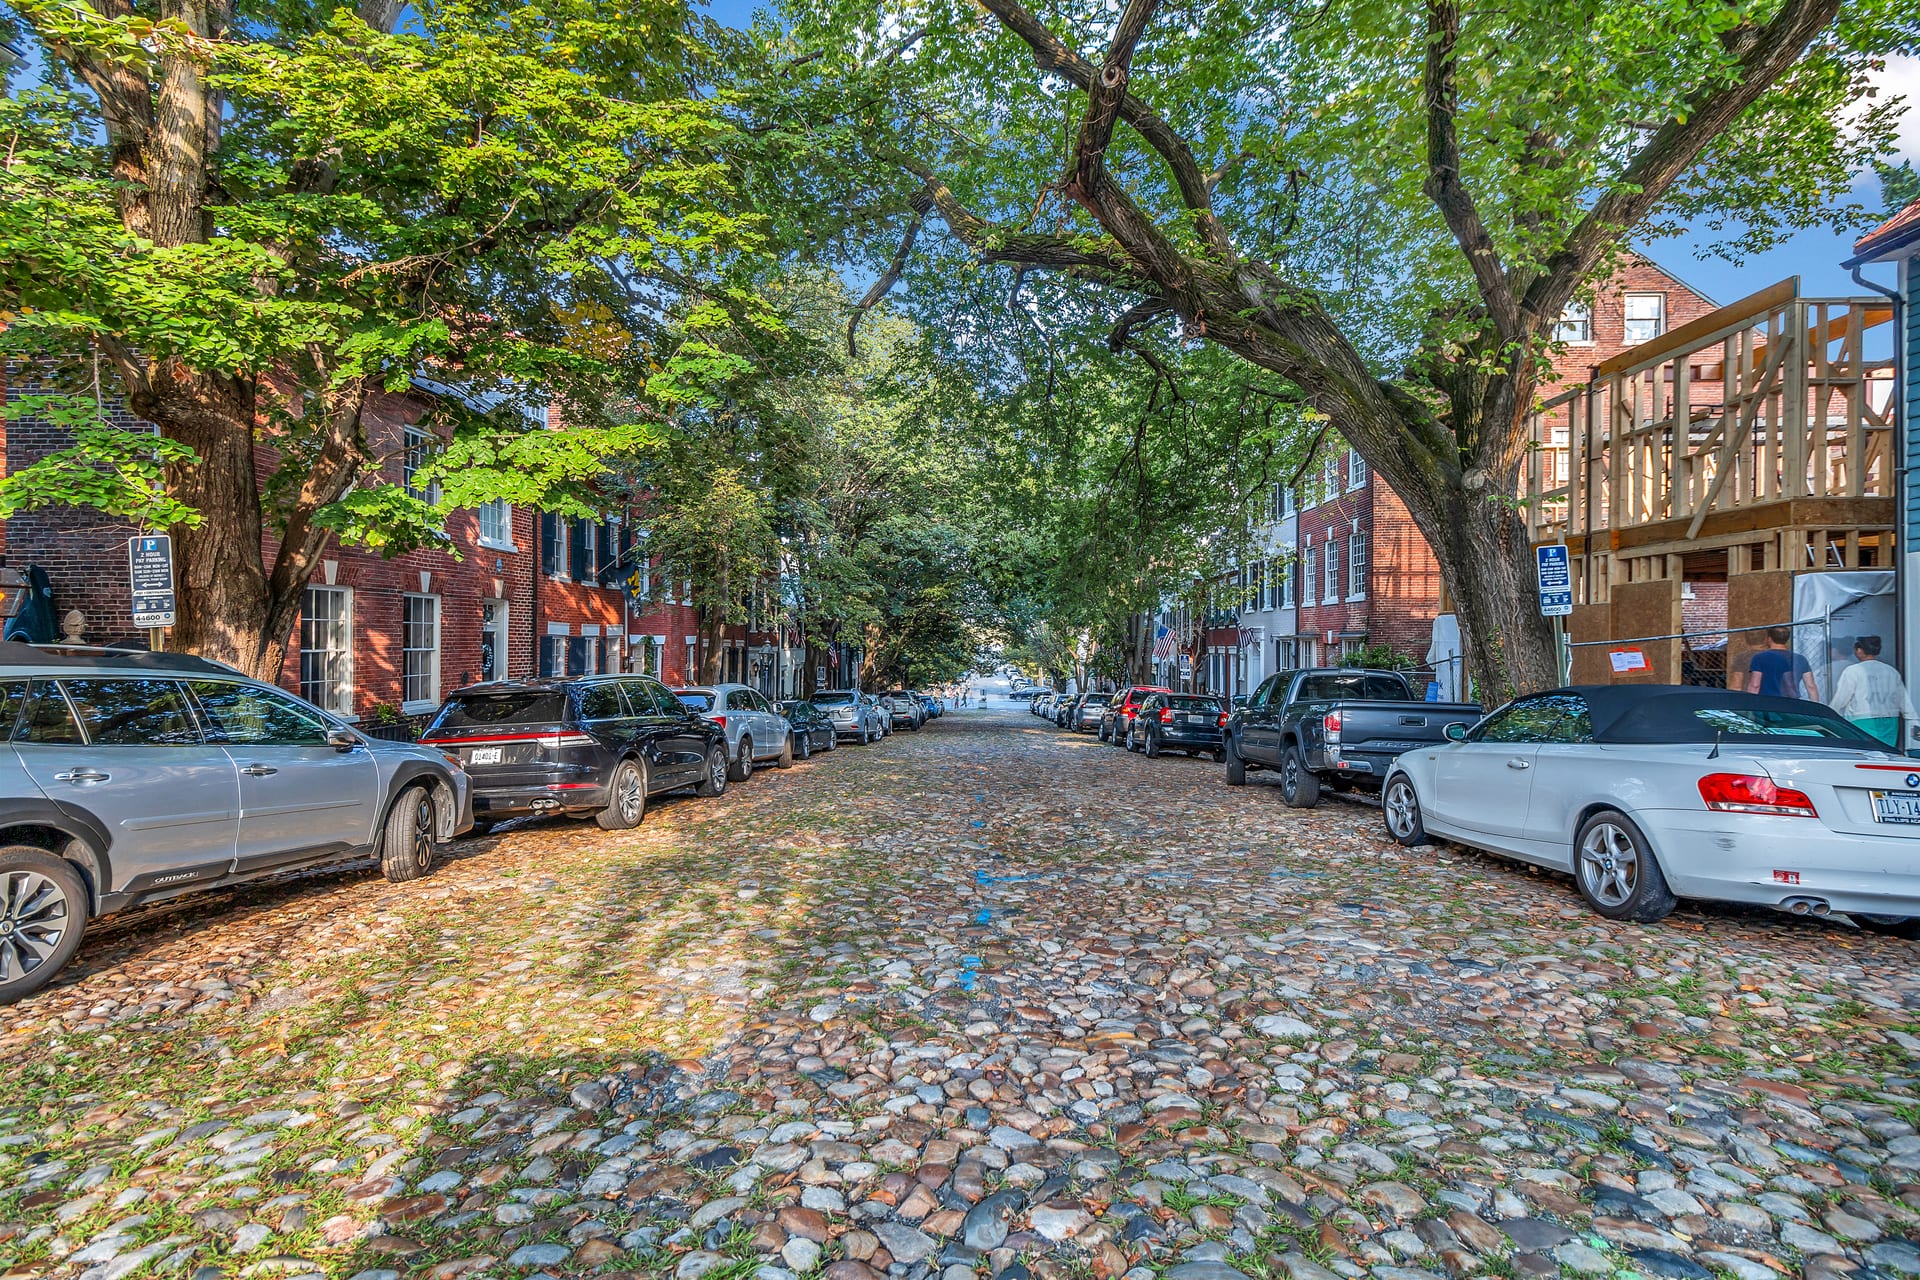
Alexandria includes historic Old Town, Metro-oriented condo communities and quieter residential neighborhoods. The city median blends very different housing choices, so the property-type comparison is especially important here.
What changed: the July median sale price was +7.0% from July 2025, while closed sales were -3.0%. Detached homes posted a $1,095,000 median, compared with $875,000 for townhouses and $405,000 for condos. The typical condo took longer to sell than a townhouse, a reminder that property type can matter as much as the county name.
The three busiest ZIP codes
These ZIP codes recorded the most closed sales in July. Volume is a useful starting point, but the price and days-on-market columns show why buyers and sellers should compare the neighborhood and property type—not just the county average.22314
$862,000 Median sale price22304
$400,000 Median sale price22302
$422,500 Median sale priceHow the property types compare
| Property type | Closed sales | Median price | Median DOM | Sale/list |
|---|---|---|---|---|
| Condo | 99 | $405,000 | 15 days | 99.5% |
| Townhouse | 48 | $875,000 | 7.5 days | 100.8% |
| Single-family | 45 | $1,095,000 | 6 days | 100.5% |
Stafford County real estate market
Stafford recorded 218 closings at a $575,000 median. Homes typically took 15 days to sell—still a brisk pace, but slower than the inner Northern Virginia counties and therefore a market where preparation and pricing matter.
Stafford offers a lower median entry point than the closer-in Northern Virginia counties, but detached homes dominate the local sales mix. Longer travel distances and a larger share of seller assistance can shape negotiations.
What changed: the July median sale price was +4.9% from July 2025, while closed sales were +7.9%. Detached homes posted a $600,000 median, compared with $416,400 for townhouses and $391,758 for condos. The typical condo took longer to sell than a townhouse, a reminder that property type can matter as much as the county name.
The three busiest ZIP codes
These ZIP codes recorded the most closed sales in July. Volume is a useful starting point, but the price and days-on-market columns show why buyers and sellers should compare the neighborhood and property type—not just the county average.22554
$599,000 Median sale price22406
$572,850 Median sale price22405
$537,450 Median sale priceHow the property types compare
| Property type | Closed sales | Median price | Median DOM | Sale/list |
|---|---|---|---|---|
| Single-family | 181 | $600,000 | 12 days | 100.0% |
| Townhouse | 31 | $416,400 | 20 days | 99.6% |
| Condo | 6 | $391,758 | 25 days | 97.9% |
Mortgage rates changed the payment story
The July 2026 30-year fixed mortgage rate averaged about 6.54% in our model. Even though the regional median price was higher than a year ago, the modeled principal-and-interest payment was slightly lower because the rate eased.
What this means for buyers
Competition has not disappeared: nearly two-thirds of homes sold at or above asking. But the opportunity is uneven. Condos generally offer more time and more negotiating room than townhouses or detached homes.- Compare payment—not just price—across ZIP codes and property types.
- Get fully underwritten before touring the most competitive segments.
- Look for homes that have exceeded the local median days on market.
- Budget for taxes, insurance and association fees before choosing a ceiling.
What this means for sellers
A 100% regional sale-to-list ratio does not mean every home sells at asking. Condition, launch strategy and the correct comparison set determine whether a listing becomes part of the 65.4% at-or-above group.- Price against recent competing sales in the same property type.
- Treat the first two weeks as the most important marketing window.
- Prepare for concession requests, especially in condo and townhouse segments.
- Use ZIP-level speed and inventory to set expectations before launch.
How to read this report
This analysis uses Bright MLS closed-sales data imported for July 2026 and compares geography and property-type segments within Alexandria City, Arlington, Fairfax, Loudoun, Prince William and Stafford. Median values reduce the influence of extreme outliers. New-construction transactions should be reviewed separately when identifying “largest over asking” or “best deal” stories because a builder’s base price may not reflect design-center upgrades.Market statistics are descriptive, not a guarantee of future results. All information is believed reliable but should be independently verified. Mortgage examples are illustrative and are not a loan quote.
Try the data
How might the market have changed your home's value?
Choose a ZIP code, property type and purchase month, then enter what you paid. We will apply the change in the closest available market segment through July 2026. Add your estimated mortgage balance to see an equity range.
Complete the fields above to see an estimated value range and the data used.
Want a closer look?
Turn this estimate into a local value review
Your estimate is only a starting point. Share your contact information if you would like Abraham to review recent comparable sales, property condition and neighborhood-level factors.
This is an educational market estimate—not an appraisal, automated valuation model or promise of value. Condition, renovations, exact location and comparable sales can materially change a home's value.
July 2026 sale bookends
What the highest and lowest verified sales looked like
These are not county averages. They are the highest- and lowest-priced July closings we could verify after excluding likely 2025–2026 new construction, where a builder's base price can distort the comparison.
| County | Address | Property type | Final list | Sold | DOM |
|---|---|---|---|---|---|
| Fairfax CountyHighest verified sale | 6719 Wemberly WayMclean, VA 22101 | Detached home | $5,750,000 | $5,750,000 | 12 |
| Fairfax CountyLowest verified sale | 1554-1a Northgate Sq #APT 1AReston, VA 20190 | Condo | $150,000 | $150,000 | 13 |
| Loudoun CountyHighest verified sale | 36279 & 36285 E Loudoun StRound Hill, VA 20141 | Detached home | $5,500,000 | $4,600,000 | 11 |
| Loudoun CountyLowest verified sale | 125-K Clubhouse Dr SW #11Leesburg, VA 20175 | Condo | $224,900 | $215,000 | 86 |
| Prince William CountyHighest verified sale | 4508 Dodds Mill DrHaymarket, VA 20169 | Detached home | $2,275,000 | $2,225,000 | 6 |
| Prince William CountyLowest verified sale | 6073 TridentWoodbridge, VA 22193 | Townhouse | $180,000 | $180,000 | 0 |
| Arlington CountyHighest verified sale | 4910 Little Falls RdArlington, VA 22207 | Detached home | $4,595,000 | $4,315,000 | 22 |
| Arlington CountyLowest verified sale | 1121 Arlington Blvd #935Arlington, VA 22209 | Condo | $132,000 | $127,500 | 21 |
| City of AlexandriaHighest verified sale | 516 Duke StAlexandria, VA 22314 | Detached home | $3,650,000 | $3,706,999 | 8 |
| City of AlexandriaLowest verified sale | 60 S Van Dorn St #415Alexandria, VA 22304 | Condo | $165,000 | $165,000 | 15 |
| Stafford CountyHighest verified sale | 945 Widewater RdStafford, VA 22554 | Detached home | $1,545,000 | $1,545,000 | 0 |
| Stafford CountyLowest verified sale | 308 Surry #128Stafford, VA 22556 | Condo | $260,000 | $260,000 | 13 |
Source: Bright MLS closed-sale export. Listing-agent and brokerage attribution were not included in the current export, so this table does not reproduce listing media.
How to read this report
Methodology and important context
This page summarizes Bright MLS closed-sale data for July 2026 and compares it with the matching period where noted. Figures are believed reliable but are not guaranteed and should not be treated as an appraisal or prediction.
What is included
Closed sales, median sale price, median days on market and sale-to-list ratio are grouped by region, county, ZIP code and property type when the export provides enough observations.
How outliers are handled
The highest- and lowest-sale examples exclude likely 2025–2026 new-construction closings because builder base prices and later options can distort list-to-sale comparisons.
Estimator limits
The calculator maps a selected ZIP to its county and applies the closest available county and property-type trend. It is educational—not an appraisal, automated valuation model or promise of value.
Five-year archive
Previous Northern Virginia market updates
Open any month for a concise year-over-year story, county selector and property-type comparison. Only the month you choose is rendered, which keeps the archive fast on mobile.
2026
June 20263,400 sales at a $735,000 median8 days · 100.4% sale-to-list
June 2026 recorded 3,400 closed sales across the six markets in this report. The median sale price rose 3.9% from a year earlier, while closed-sale volume rose 5.1% from a year earlier. The typical sale took 8 days and closed at 100.4% of its final list price.
May 20263,408 sales at a $735,000 median6 days · 101.0% sale-to-list
May 2026 recorded 3,408 closed sales across the six markets in this report. The median sale price rose 3.3% from a year earlier, while closed-sale volume rose 7.7% from a year earlier. The typical sale took 6 days and closed at 101.0% of its final list price.
April 20262,934 sales at a $730,000 median6 days · 101.1% sale-to-list
April 2026 recorded 2,934 closed sales across the six markets in this report. The median sale price rose 4.0% from a year earlier, while closed-sale volume rose 2.2% from a year earlier. The typical sale took 6 days and closed at 101.1% of its final list price.
March 20262,403 sales at a $689,000 median7 days · 100.8% sale-to-list
March 2026 recorded 2,403 closed sales across the six markets in this report. The median sale price fell 2.6% from a year earlier, while closed-sale volume rose 13.1% from a year earlier. The typical sale took 7 days and closed at 100.8% of its final list price.
February 20261,792 sales at a $669,944 median9 days · 100.3% sale-to-list
February 2026 recorded 1,792 closed sales across the six markets in this report. The median sale price rose 0.7% from a year earlier, while closed-sale volume rose 8.6% from a year earlier. The typical sale took 9 days and closed at 100.3% of its final list price.
January 20261,474 sales at a $629,995 median24 days · 99.4% sale-to-list
January 2026 recorded 1,474 closed sales across the six markets in this report. The median sale price fell 0.1% from a year earlier, while closed-sale volume fell 2.3% from a year earlier. The typical sale took 24 days and closed at 99.4% of its final list price.
2025
December 20252,224 sales at a $674,995 median20 days · 99.3% sale-to-list
December 2025 recorded 2,224 closed sales across the six markets in this report. The median sale price rose 3.8% from a year earlier, while closed-sale volume rose 1.4% from a year earlier. The typical sale took 20 days and closed at 99.3% of its final list price.
November 20252,089 sales at a $680,000 median16 days · 99.4% sale-to-list
November 2025 recorded 2,089 closed sales across the six markets in this report. The median sale price rose 3.8% from a year earlier, while closed-sale volume fell 2.6% from a year earlier. The typical sale took 16 days and closed at 99.4% of its final list price.
October 20252,603 sales at a $690,000 median13 days · 99.4% sale-to-list
October 2025 recorded 2,603 closed sales across the six markets in this report. The median sale price rose 6.2% from a year earlier, while closed-sale volume rose 3.6% from a year earlier. The typical sale took 13 days and closed at 99.4% of its final list price.
September 20252,436 sales at a $675,000 median14 days · 99.6% sale-to-list
September 2025 recorded 2,436 closed sales across the six markets in this report. The median sale price rose 1.5% from a year earlier, while closed-sale volume rose 5.7% from a year earlier. The typical sale took 14 days and closed at 99.6% of its final list price.
August 20252,710 sales at a $690,000 median12 days · 99.7% sale-to-list
August 2025 recorded 2,710 closed sales across the six markets in this report. The median sale price rose 2.2% from a year earlier, while closed-sale volume rose 0.1% from a year earlier. The typical sale took 12 days and closed at 99.7% of its final list price.
July 20252,944 sales at a $690,000 median11 days · 99.8% sale-to-list
July 2025 recorded 2,944 closed sales across the six markets in this report. The median sale price rose 2.2% from a year earlier, while closed-sale volume fell 0.8% from a year earlier. The typical sale took 11 days and closed at 99.8% of its final list price.
June 20253,236 sales at a $707,495 median8 days · 100.2% sale-to-list
June 2025 recorded 3,236 closed sales across the six markets in this report. The median sale price rose 0.4% from a year earlier, while closed-sale volume rose 7.6% from a year earlier. The typical sale took 8 days and closed at 100.2% of its final list price.
May 20253,163 sales at a $711,403 median7 days · 100.7% sale-to-list
May 2025 recorded 3,163 closed sales across the six markets in this report. The median sale price rose 4.3% from a year earlier, while closed-sale volume fell 2.1% from a year earlier. The typical sale took 7 days and closed at 100.7% of its final list price.
April 20252,872 sales at a $701,998 median6 days · 101.1% sale-to-list
April 2025 recorded 2,872 closed sales across the six markets in this report. The median sale price rose 2.5% from a year earlier, while closed-sale volume fell 0.6% from a year earlier. The typical sale took 6 days and closed at 101.1% of its final list price.
March 20252,125 sales at a $707,500 median6 days · 101.2% sale-to-list
March 2025 recorded 2,125 closed sales across the six markets in this report. The median sale price rose 5.6% from a year earlier, while closed-sale volume fell 2.7% from a year earlier. The typical sale took 6 days and closed at 101.2% of its final list price.
February 20251,650 sales at a $665,000 median6 days · 101.0% sale-to-list
February 2025 recorded 1,650 closed sales across the six markets in this report. The median sale price rose 5.6% from a year earlier, while closed-sale volume fell 9.3% from a year earlier. The typical sale took 6 days and closed at 101.0% of its final list price.
January 20251,508 sales at a $630,750 median13 days · 100.2% sale-to-list
January 2025 recorded 1,508 closed sales across the six markets in this report. The median sale price rose 5.0% from a year earlier, while closed-sale volume rose 1.5% from a year earlier. The typical sale took 13 days and closed at 100.2% of its final list price.
2024
December 20242,194 sales at a $650,000 median12 days · 100.2% sale-to-list
December 2024 recorded 2,194 closed sales across the six markets in this report. The median sale price rose 4.8% from a year earlier, while closed-sale volume rose 25.6% from a year earlier. The typical sale took 12 days and closed at 100.2% of its final list price.
November 20242,144 sales at a $655,000 median11 days · 100.0% sale-to-list
November 2024 recorded 2,144 closed sales across the six markets in this report. The median sale price rose 6.0% from a year earlier, while closed-sale volume rose 10.7% from a year earlier. The typical sale took 11 days and closed at 100.0% of its final list price.
October 20242,512 sales at a $650,000 median8 days · 100.4% sale-to-list
October 2024 recorded 2,512 closed sales across the six markets in this report. The median sale price rose 6.6% from a year earlier, while closed-sale volume rose 14.5% from a year earlier. The typical sale took 8 days and closed at 100.4% of its final list price.
September 20242,304 sales at a $665,000 median9 days · 100.2% sale-to-list
September 2024 recorded 2,304 closed sales across the six markets in this report. The median sale price rose 8.1% from a year earlier, while closed-sale volume rose 4.8% from a year earlier. The typical sale took 9 days and closed at 100.2% of its final list price.
August 20242,707 sales at a $675,000 median8 days · 100.5% sale-to-list
August 2024 recorded 2,707 closed sales across the six markets in this report. The median sale price rose 4.7% from a year earlier, while closed-sale volume fell 2.9% from a year earlier. The typical sale took 8 days and closed at 100.5% of its final list price.
July 20242,968 sales at a $675,000 median7 days · 101.0% sale-to-list
July 2024 recorded 2,968 closed sales across the six markets in this report. The median sale price rose 6.3% from a year earlier, while closed-sale volume rose 10.7% from a year earlier. The typical sale took 7 days and closed at 101.0% of its final list price.
June 20243,007 sales at a $704,964 median6 days · 101.6% sale-to-list
June 2024 recorded 3,007 closed sales across the six markets in this report. The median sale price rose 8.5% from a year earlier, while closed-sale volume fell 11.4% from a year earlier. The typical sale took 6 days and closed at 101.6% of its final list price.
May 20243,230 sales at a $682,000 median5 days · 102.5% sale-to-list
May 2024 recorded 3,230 closed sales across the six markets in this report. The median sale price rose 4.9% from a year earlier, while closed-sale volume fell 1.1% from a year earlier. The typical sale took 5 days and closed at 102.5% of its final list price.
April 20242,889 sales at a $685,000 median5 days · 102.3% sale-to-list
April 2024 recorded 2,889 closed sales across the six markets in this report. The median sale price rose 9.6% from a year earlier, while closed-sale volume rose 10.3% from a year earlier. The typical sale took 5 days and closed at 102.3% of its final list price.
March 20242,185 sales at a $670,000 median5 days · 101.9% sale-to-list
March 2024 recorded 2,185 closed sales across the six markets in this report. The median sale price rose 10.7% from a year earlier, while closed-sale volume fell 12.0% from a year earlier. The typical sale took 5 days and closed at 101.9% of its final list price.
February 20241,819 sales at a $630,000 median6 days · 101.0% sale-to-list
February 2024 recorded 1,819 closed sales across the six markets in this report. The median sale price rose 9.6% from a year earlier, while closed-sale volume fell 1.4% from a year earlier. The typical sale took 6 days and closed at 101.0% of its final list price.
January 20241,486 sales at a $600,918 median14 days · 99.9% sale-to-list
January 2024 recorded 1,486 closed sales across the six markets in this report. The median sale price rose 4.7% from a year earlier, while closed-sale volume rose 3.0% from a year earlier. The typical sale took 14 days and closed at 99.9% of its final list price.
2023
December 20231,747 sales at a $620,000 median12 days · 99.7% sale-to-list
December 2023 recorded 1,747 closed sales across the six markets in this report. The median sale price rose 12.0% from a year earlier, while closed-sale volume fell 12.7% from a year earlier. The typical sale took 12 days and closed at 99.7% of its final list price.
November 20231,937 sales at a $618,000 median8 days · 100.0% sale-to-list
November 2023 recorded 1,937 closed sales across the six markets in this report. The median sale price rose 6.6% from a year earlier, while closed-sale volume fell 9.0% from a year earlier. The typical sale took 8 days and closed at 100.0% of its final list price.
October 20232,194 sales at a $610,000 median7 days · 100.4% sale-to-list
October 2023 recorded 2,194 closed sales across the six markets in this report. The median sale price rose 2.5% from a year earlier, while closed-sale volume fell 12.1% from a year earlier. The typical sale took 7 days and closed at 100.4% of its final list price.
September 20232,199 sales at a $615,000 median7 days · 100.6% sale-to-list
September 2023 recorded 2,199 closed sales across the six markets in this report. The median sale price rose 7.0% from a year earlier, while closed-sale volume fell 23.0% from a year earlier. The typical sale took 7 days and closed at 100.6% of its final list price.
August 20232,789 sales at a $645,000 median6 days · 100.8% sale-to-list
August 2023 recorded 2,789 closed sales across the six markets in this report. The median sale price rose 10.1% from a year earlier, while closed-sale volume fell 15.4% from a year earlier. The typical sale took 6 days and closed at 100.8% of its final list price.
July 20232,680 sales at a $634,950 median6 days · 101.4% sale-to-list
July 2023 recorded 2,680 closed sales across the six markets in this report. The median sale price rose 5.0% from a year earlier, while closed-sale volume fell 20.6% from a year earlier. The typical sale took 6 days and closed at 101.4% of its final list price.
June 20233,392 sales at a $650,000 median6 days · 101.7% sale-to-list
June 2023 recorded 3,392 closed sales across the six markets in this report. The median sale price rose 4.0% from a year earlier, while closed-sale volume fell 19.2% from a year earlier. The typical sale took 6 days and closed at 101.7% of its final list price.
May 20233,265 sales at a $650,000 median5 days · 102.1% sale-to-list
May 2023 recorded 3,265 closed sales across the six markets in this report. The median sale price rose 1.6% from a year earlier, while closed-sale volume fell 26.0% from a year earlier. The typical sale took 5 days and closed at 102.1% of its final list price.
April 20232,619 sales at a $625,000 median5 days · 101.7% sale-to-list
April 2023 recorded 2,619 closed sales across the six markets in this report. The median sale price fell 1.6% from a year earlier, while closed-sale volume fell 33.7% from a year earlier. The typical sale took 5 days and closed at 101.7% of its final list price.
March 20232,483 sales at a $605,000 median6 days · 100.9% sale-to-list
March 2023 recorded 2,483 closed sales across the six markets in this report. The median sale price rose 0.1% from a year earlier, while closed-sale volume fell 32.6% from a year earlier. The typical sale took 6 days and closed at 100.9% of its final list price.
February 20231,844 sales at a $575,000 median10 days · 100.0% sale-to-list
February 2023 recorded 1,844 closed sales across the six markets in this report. The median sale price rose 0.9% from a year earlier, while closed-sale volume fell 25.6% from a year earlier. The typical sale took 10 days and closed at 100.0% of its final list price.
January 20231,443 sales at a $574,000 median25 days · 98.9% sale-to-list
January 2023 recorded 1,443 closed sales across the six markets in this report. The median sale price rose 8.3% from a year earlier, while closed-sale volume fell 33.7% from a year earlier. The typical sale took 25 days and closed at 98.9% of its final list price.
2022
December 20222,002 sales at a $553,500 median19 days · 99.0% sale-to-list
December 2022 recorded 2,002 closed sales across the six markets in this report. The median sale price rose 0.7% from a year earlier, while closed-sale volume fell 44.0% from a year earlier. The typical sale took 19 days and closed at 99.0% of its final list price.
November 20222,128 sales at a $579,995 median15 days · 99.2% sale-to-list
November 2022 recorded 2,128 closed sales across the six markets in this report. The median sale price rose 5.5% from a year earlier, while closed-sale volume fell 46.2% from a year earlier. The typical sale took 15 days and closed at 99.2% of its final list price.
October 20222,497 sales at a $595,000 median13 days · 99.5% sale-to-list
October 2022 recorded 2,497 closed sales across the six markets in this report. The median sale price rose 6.3% from a year earlier, while closed-sale volume fell 36.2% from a year earlier. The typical sale took 13 days and closed at 99.5% of its final list price.
September 20222,857 sales at a $575,000 median14 days · 99.5% sale-to-list
September 2022 recorded 2,857 closed sales across the six markets in this report. The median sale price rose 5.5% from a year earlier, while closed-sale volume fell 29.7% from a year earlier. The typical sale took 14 days and closed at 99.5% of its final list price.
August 20223,296 sales at a $585,773 median11 days · 99.8% sale-to-list
August 2022 recorded 3,296 closed sales across the six markets in this report. The median sale price rose 6.5% from a year earlier, while closed-sale volume fell 28.5% from a year earlier. The typical sale took 11 days and closed at 99.8% of its final list price.
July 20223,377 sales at a $605,000 median7 days · 100.7% sale-to-list
July 2022 recorded 3,377 closed sales across the six markets in this report. The median sale price rose 5.2% from a year earlier, while closed-sale volume fell 31.0% from a year earlier. The typical sale took 7 days and closed at 100.7% of its final list price.
June 20224,200 sales at a $625,000 median6 days · 102.0% sale-to-list
June 2022 recorded 4,200 closed sales across the six markets in this report. The median sale price rose 5.9% from a year earlier, while closed-sale volume fell 25.2% from a year earlier. The typical sale took 6 days and closed at 102.0% of its final list price.
May 20224,415 sales at a $640,000 median5 days · 103.6% sale-to-list
May 2022 recorded 4,415 closed sales across the six markets in this report. The median sale price rose 8.5% from a year earlier, while closed-sale volume fell 11.6% from a year earlier. The typical sale took 5 days and closed at 103.6% of its final list price.
April 20223,952 sales at a $635,000 median5 days · 104.2% sale-to-list
April 2022 recorded 3,952 closed sales across the six markets in this report. The median sale price rose 10.4% from a year earlier, while closed-sale volume fell 16.6% from a year earlier. The typical sale took 5 days and closed at 104.2% of its final list price.
March 20223,685 sales at a $604,200 median5 days · 103.7% sale-to-list
March 2022 recorded 3,685 closed sales across the six markets in this report. The median sale price rose 11.9% from a year earlier, while closed-sale volume fell 3.4% from a year earlier. The typical sale took 5 days and closed at 103.7% of its final list price.
February 20222,479 sales at a $570,000 median5 days · 102.4% sale-to-list
February 2022 recorded 2,479 closed sales across the six markets in this report. The median sale price rose 9.6% from a year earlier, while closed-sale volume fell 10.0% from a year earlier. The typical sale took 5 days and closed at 102.4% of its final list price.
January 20222,177 sales at a $529,990 median9 days · 100.6% sale-to-list
January 2022 recorded 2,177 closed sales across the six markets in this report. The median sale price rose 6.0% from a year earlier, while closed-sale volume fell 15.5% from a year earlier. The typical sale took 9 days and closed at 100.6% of its final list price.
2021
December 20213,572 sales at a $549,900 median10 days · 100.5% sale-to-list
December 2021 recorded 3,572 closed sales across the six markets in this report. The median sale price rose 7.8% from a year earlier, while closed-sale volume fell 4.8% from a year earlier. The typical sale took 10 days and closed at 100.5% of its final list price.
November 20213,954 sales at a $550,000 median9 days · 100.3% sale-to-list
November 2021 recorded 3,954 closed sales across the six markets in this report. The median sale price rose 6.8% from a year earlier, while closed-sale volume rose 9.1% from a year earlier. The typical sale took 9 days and closed at 100.3% of its final list price.
October 20213,913 sales at a $560,000 median8 days · 100.4% sale-to-list
October 2021 recorded 3,913 closed sales across the six markets in this report. The median sale price rose 8.5% from a year earlier, while closed-sale volume fell 10.2% from a year earlier. The typical sale took 8 days and closed at 100.4% of its final list price.
September 20214,064 sales at a $545,000 median8 days · 100.5% sale-to-list
September 2021 recorded 4,064 closed sales across the six markets in this report. The median sale price rose 4.8% from a year earlier, while closed-sale volume fell 4.0% from a year earlier. The typical sale took 8 days and closed at 100.5% of its final list price.
August 20214,610 sales at a $550,000 median7 days · 101.0% sale-to-list
August 2021 recorded 4,610 closed sales across the six markets in this report. The median sale price rose 4.9% from a year earlier, while closed-sale volume rose 4.0% from a year earlier. The typical sale took 7 days and closed at 101.0% of its final list price.
