I went into this exercise believing the original Reddit post was wrong.
I am a real estate agent. I believe in the benefits of homeownership, and I am naturally biased in its favor. When someone argued that renting a similar Northern Virginia home could cost far less than buying it, I opened Bright MLS expecting to find the flaw.
Instead, I found a Reston example that made me reconsider my answer.
The short version
- A comparable detached Reston home costs approximately $1,125,000 to buy or $4,500 per month to rent.
- A 20 percent down payment is $225,000.
- The modeled initial cost of owning is approximately $8,271 per month, before homeowners insurance, possible flood insurance, HOA dues, renovations, and buyer closing costs.
- If the renter invests the down payment and the changing monthly savings, the model produces approximately $2.91 million after 20 years. The homeowner has approximately $1.37 million in equity before selling costs.
- That is a scenario, not a forecast. The result depends heavily on investment returns, appreciation, maintenance, rent growth, and whether either person actually follows the plan.
I started by trying to prove the renter wrong. I could not.
The Reston homes I compared
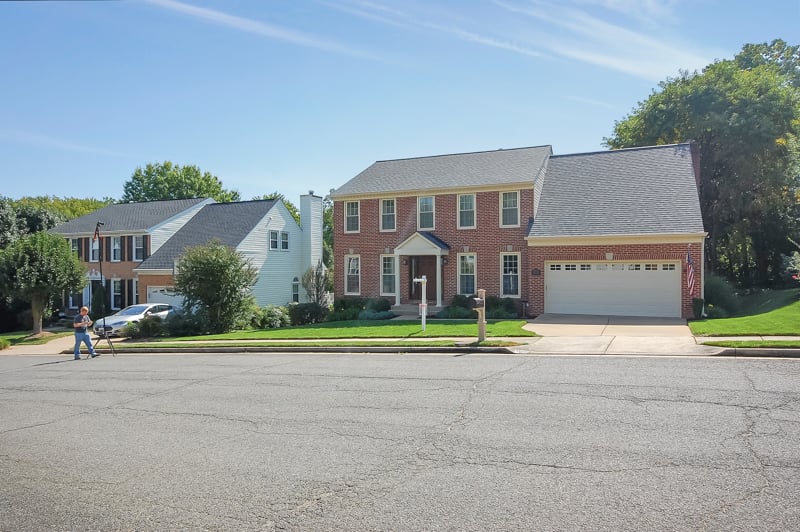
I found a detached four bedroom Reston home offered for rent at $4,500 per month. At the time of this analysis, it had three and a half bathrooms, 2,868 finished square feet, a 0.37 acre lot, and included lawn care.
View the Reston rental used in this comparison
I then searched Bright MLS for detached Reston homes with four bedrooms and 2,500 to 4,000 finished square feet. For the selected historical years, I used the same January 1 through September 2 window.
| Year | Median sale price | Median rent | Sales | Rentals |
|---|---|---|---|---|
| 2006 | $674,900 | $2,800 | 9 | 3 |
| 2011 | $647,500 | $3,100 | 16 | 9 |
| 2016 | $664,000 | $2,750 | 30 | 5 |
| 2019 | $747,250 | $3,500 | 28 | 5 |
| 2021 | $850,000 | $3,450 | 31 | 3 |
| 2026 | $1,125,000 | $5,250 | 33 | 4 |
The rental samples are small. That matters. I expanded the current search to the trailing 12 months and found six comparable rentals with a median rent of $4,775. For the current comparison, I used the actual $4,500 active rental linked above.
Reston was not my first choice. I initially considered Franklin Farm, but there were not enough comparable detached rentals to support the comparison. That is a real limitation at this price point. If you cannot find the right detached rental, you may have to choose a townhouse, accept a different location, or buy. If the renter consumes less housing, part of the apparent savings comes from choosing a different product.
What would the same type of home cost to own?
At a $1,125,000 purchase price, a buyer putting 20 percent down needs $225,000 upfront and a $900,000 mortgage. Using Freddie Mac’s 6.66 percent national average for a 30 year fixed mortgage as of August 27, 2026, principal and interest would be approximately $5,784 per month. That rate is a benchmark, not a quote to a particular borrower.
| Monthly expense | Estimated amount |
|---|---|
| Principal and interest | $5,784 |
| Fairfax County property tax and countywide charges | $1,081 |
| Maintenance at 1 percent | $938 |
| Maintenance at 1.5 percent | $1,406 |
| Maintenance at 2 percent | $1,875 |
Using the 1.5 percent maintenance sensitivity, the initial comparison is:
| Option | Monthly cash outflow |
|---|---|
| Buying | $8,271 |
| Renting | $4,500 |
| Initial difference available to invest | $3,771 |
Part of the mortgage payment builds equity. The homeowner receives credit in the model for every dollar of principal paid and for appreciation. The full payment appears here because this table compares monthly cash flow.
The maintenance figure is modeled as an annual expenditure, not merely a reserve that remains in the homeowner’s account. Actual spending will be irregular. A roof, HVAC system, kitchen, bathroom, or major paint job does not arrive on a smooth schedule.
There is an important weakness in using a percentage of total market value, especially for an expensive Northern Virginia property. There is no roof to replace on the land, and there is no HVAC system inside the location premium. Applying 1.5 percent to the entire value of a $1.125 million Reston property can therefore overstate the cost attributable to the structure.
A better model would work more like a condominium reserve study. It would identify major components, estimate their remaining useful lives and replacement costs, and calculate the amount that should be set aside for each. Virginia condominium reserve studies apply that process to common capital components. Individual homeowners rarely maintain the same type of schedule, so their costs tend to arrive as irregular shocks. Condominium fees also pay for operations such as insurance, management, staffing, utilities, and amenities, so reserves are only part of that comparison.
Until I build a component-level estimate for this particular home, the 1 percent, 1.5 percent, and 2 percent figures should be read as broad sensitivity tests rather than precise maintenance forecasts.
Some Reston parcels could also owe district taxes. Fairfax County says the exact rates depend on the parcel’s tax district. The model includes the 2026 county base rate and countywide charges but does not assume every possible Reston district charge.
The renter’s savings shrink as rent rises
The renter does not keep saving $3,771 every month for 20 years. I increased rent by 2.7 percent annually and recalculated the difference each month.
| Time | Modeled monthly rent |
|---|---|
| Today | $4,500 |
| 5 years | $5,141 |
| 10 years | $5,874 |
| 15 years | $6,711 |
| 20 years | $7,667 |
The homeowner’s principal and interest payment stays fixed, but property taxes and maintenance rise with the modeled home value. Both households face increasing costs.
The 2.7 percent assumption comes from annualizing the increase between the 2006 median rent of $2,800 and the current trailing 12 month median of $4,775. That average hides two very different periods.
| Period | Starting rent | Ending rent | Increase | Annualized growth |
|---|---|---|---|---|
| 2006 through 2019 | $2,800 | $3,500 | $700 | Approximately 1.7 percent |
| 2019 through 2026 | $3,500 | $4,775 | $1,275 | Approximately 4.5 percent |
| 2006 through 2026 | $2,800 | $4,775 | $1,975 | Approximately 2.7 percent |
Before 2019, the median increased by $700 over 13 years. From 2019 through 2026, it increased by another $1,275. The pandemic era coincided with much faster increases in Reston rents and prices. That does not prove the pandemic caused every dollar of the increase. It does show why 2.7 percent is a scenario rather than a prediction.
What happens if the renter invests the difference?
I modeled the renter investing the $225,000 that otherwise would have become the down payment, plus the remaining monthly savings, in a low cost S&P 500 index fund with dividends reinvested.
For the homeowner, I assumed 2.6 percent annual appreciation. That is approximately the annualized change between the 2006 and 2026 median sale prices in this search. A change in neighborhood medians is not the same thing as appreciation of one specific house, so I use it only as a transparent modeling assumption.
For the renter, I assumed 2.7 percent annual rent growth and an 8 percent annual investment return. The dollar amounts are nominal, so they are not adjusted for inflation.
| Time from today | Homeowner equity | Renter portfolio | Difference |
|---|---|---|---|
| 5 years | $434,000 | $595,000 | Renter ahead by $161,000 |
| 10 years | $686,000 | $1,116,000 | Renter ahead by $430,000 |
| 15 years | $993,000 | $1,854,000 | Renter ahead by $861,000 |
| 20 years | $1,370,000 | $2,907,000 | Renter ahead by $1,538,000 |
These balances are before liquidation and taxes. The homeowner’s balance is the modeled home value minus the remaining mortgage. The renter’s balance includes the invested down payment and monthly contributions, with no assumed fund fee or tax drag.
If the homeowner sold after 20 years and paid an illustrative 6 percent selling cost, the balance would fall to approximately $1.26 million. Selling costs are negotiable and vary. The renter could owe capital gains taxes if the investments were sold, depending on the account and the renter’s tax situation. A homeowner who satisfies the applicable ownership and use tests may qualify to exclude up to $250,000 of gain from federal income, or up to $500,000 on many joint returns. That potential exclusion favors the homeowner, but the actual tax result is household-specific.
I also tested a more conservative case using a 6 percent investment return and 1 percent annual maintenance. Before selling costs and taxes, the renter finished approximately $550,000 ahead after 20 years. If the homeowner then sold and paid the same illustrative 6 percent selling cost used above, the renter’s lead would increase to approximately $662,000 before any tax owed on the renter’s investments.
What if the decision started in a different year?
This second comparison is partly historical and partly modeled. The sale prices and rents are Bright MLS medians observed in six selected years, not an annual series and not a same house tracked through time. Between those snapshots, the model uses geometric interpolation. It also applies historical Fairfax County tax rates, Freddie Mac mortgage rate benchmarks, and annual S&P 500 total returns converted to monthly equivalents.
| Starting year | Homeowner equity | Renter portfolio | Result before liquidation and taxes |
|---|---|---|---|
| 2006 | $826,000 | $3,102,000 | Renter ahead by $2,276,000 |
| 2011 | $787,000 | $1,576,000 | Renter ahead by $789,000 |
| 2016 | $714,000 | $728,000 | Essentially tied |
| 2019 | $617,000 | $550,000 | Owner ahead by $67,000 |
| 2021 | $522,000 | $402,000 | Owner ahead by $120,000 |
Small differences deserve caution. For example, applying an illustrative 6 percent selling cost to the homeowner would nearly erase the 2019 advantage before considering taxes on either side.
I also tested a no cost refinance scenario when benchmark mortgage rates fell. It improved the homeowner outcomes, but it did not reverse the 2006 or 2011 results. Real refinancing has eligibility requirements and closing costs, so this sensitivity test is intentionally favorable to the homeowner.
A future refinance should not be the foundation of today’s purchase decision. Rates may fall, rise, or remain elevated. A buyer should be comfortable with today’s known terms. A lower future rate is an opportunity, not a guarantee.
The largest assumption is human behavior
The word invests is doing an enormous amount of work in this analysis.
Renting does not automatically create wealth. The renter has to invest the $225,000 and then continue investing the monthly savings through strong markets, crashes, and everything in between. If the renter spends the difference, the homeowner’s forced equity building may produce the better result.
The homeowner also has to follow the plan. Rising equity can tempt an owner to refinance and pull out cash, sell and move to a more expensive property, or repeatedly incur transaction costs. The spreadsheet assumes the owner stays in the home and lets the equity build.
The mathematically superior plan is not automatically the plan a household will follow. In real life, the better outcome may belong to whichever household can sustain its strategy.
What about the mortgage interest deduction?
I did not include an individualized income tax benefit for the homeowner.
That omission matters, but there is no single honest tax savings figure that applies to every buyer. The benefit depends on filing status, income, marginal tax rates, the mortgage, other itemized deductions, federal and Virginia rules in each tax year, and how much itemizing exceeds the standard deduction. The deduction is not simply mortgage interest multiplied by a tax bracket.
The correct method would calculate the same household’s tax liability twice for every year, once as a homeowner and once as a renter, and invest any incremental homeowner savings. For acquisition debt incurred after December 15, 2017, federal mortgage interest deductions are generally subject to a $750,000 debt limit, with additional rules and exceptions. A tax professional should calculate the household-specific result.
What this model leaves out
The owner side excludes homeowners insurance, possible flood insurance, HOA dues, renovations beyond the modeled maintenance expenditure, buyer closing costs, moving costs, and individualized tax effects. Adding owner costs would increase the renter’s investable difference.
The renter side excludes fund fees, taxes on dividends or gains, moving costs, and the opportunity cost of a security deposit. Adding investment friction would reduce the renter’s balance.
Both households still need somewhere to live at the end of the comparison. Home equity is not spendable without selling, borrowing against it, or changing the housing plan. The renter remains exposed to future rent and rental availability.
So, is buying a home in Reston pointless?
No.
Homeownership provides stability, control over the property, protection from a landlord ending the lease, and the emotional value of having a permanent home. Those benefits are real even if a spreadsheet cannot fully price them.
But I also cannot honestly say that buying is always the stronger financial decision.
At today’s Reston prices, a disciplined renter who can find a truly comparable home and consistently invests the down payment and monthly savings could end up considerably wealthier under these assumptions.
I entered this exercise believing the original argument had to be wrong. After nearly two hours of research, modeling, and testing different angles, I ended up somewhere more interesting.
The better decision is not always the one with the better spreadsheet. It may be the one your household can actually sustain.
Test the assumptions against your own situation
Think my assumptions are wrong? Good. Change the purchase price, rent, down payment, mortgage rate, appreciation, and investment return in the Northern Virginia rent versus buy calculator.
If you are comparing actual homes in Reston or elsewhere in Northern Virginia, I can help you identify the sale and rental comps before you make the decision. Contact Ask A Walker.
Put the spreadsheet next to the actual homes.
Run your assumptions, then let me compare the sale and rental comps behind the properties you are considering.
Sources and methodology
The sale and rental figures were compiled from Bright MLS searches for detached Reston homes with four bedrooms and 2,500 to 4,000 finished square feet. Historical periods use January 1 through September 2 in the selected year. The current rental median uses the trailing 12 months. Small rental samples are shown in the table.
The mortgage comparison uses Freddie Mac’s 30 year fixed mortgage rate of 6.66 percent as of August 27, 2026. Property tax estimates use Fairfax County’s 2026 real estate tax rate and countywide charges. Historical investment scenarios use S&P 500 total returns with dividends reinvested. The 2026 historical return is 12.34 percent through September 2, 2026.
This is an illustrative market analysis, not individualized financial, tax, legal, or investment advice. The listing linked above was active when this analysis was completed and may no longer be available.
Based on information from Bright MLS for the period January 1, 2006 through September 2, 2026.
Abraham Walker, REALTOR® | Samson Properties | Office: 703-378-8810 | Equal Housing Opportunity
